


You Asked, I Delivered. A Primer on Stock Valuation
Value stocks like a pro with the free valuation calculator!

You can read on your browser by clicking here.
*Warning: This post is not for the faint hearted. Please forgive me for being more technical than how I usually write. And to quote Einstein as an excuse for me being technical in this post: “Everything Should Be Made as Simple as Possible, But Not Simpler.”
P.S. A free valuation calculator and a full list of resources on the topic of valuation is at the bottom of this post.
A month ago, I posted on socials that I was going back to basics to address your questions on valuations. I have refreshed my notes, gone through the Valuation guide by Mckinsey and revisited Aswath Damodaran’s lecture to summarize my lessons into this post and valuation spreadsheet for you.

Most of the valuation models I see are two types:
The discounted cash flow (DCF) model, and
Forward relative valuation model
The key difference between these two models is how they estimate the terminal value. When it comes to valuation, the most value (and lies) are ascribed to the terminal value.
“More fiction is written in Excel than in Word." — unknown
1. DCF Model
In the DCF model, we start by first projecting and discounting 10-years of cash flow back to the present value. Followed by estimating the terminal value using the stable growth model.
In the stable growth model, we assume that beyond year 10, the business will grow at a constant rate forever. Assuming that the business growth will roughly track global GDP growth, the growth rate applied is typically between 2% to 4%.
The terminal value is where most of the value resides. For our DCF model below, 67.9% of the intrinsic value calculation comes from year 10 and beyond!

If the table seems scary, here’s a chart I have plotted out to show how much each year's cash flow contributed to intrinsic value to make it easier to visualize.

Now, when we visualize these charts there are two incredibly important insights I would like to draw your attention to:
Firstly, the first two years worth of cash flow accounts for 5.8% of intrinsic value only. This means that during the COVID-19 induced market crash in March 2020, where the market was down more than 30%, we only had to ask ourselves two key questions to decide if the business was being irrationally priced down:
Will COVID-19 cause earnings power to be permanently impaired?
For consumer facing companies such as Starbucks for example, many outlets around the world were being shut down. But one could reasonably estimate that the shut down would probably last anywhere between 6 months to 2 years.
Without performing the DCF for Starbucks, we know that even if a business were to miss out on the first two years of cash flow, the intrinsic value should decline by no more than 5% to 10%.
Here’s what Bill Ackman had to say in his letter during the March 2020 bottom:
“The revenues and earnings for the majority of businesses over the next year or so will be extremely poor, and in some cases disastrous, but for companies with strong balance sheets, dominant market positions, and which do not need access to capital, the virus will likely only disrupt the next 12 to 24 months of cash flows. In a discounted cash flow valuation of a company, the loss or disruption of the first, and possibly second, year of cash flows, does not generally destroy more than 5% to 10% of the value of the business. The fact that many stocks have declined by 30% to 60% or more from levels that did not appear to be overvalued suggests that there are many compelling bargains in the equity markets”
But what happened instead? Starbucks' shares drew down 40.2%, from a high of $97 to $58. And of course, Ackman bought the dip and the stock price shot back up to above $100 in a year.
But before we jump onto opportunities like this in the future, we have to answer the second question.Can the business survive?
The strain on consumer businesses is real, as many still have to incur costs such as rent and wages even while their doors remain shut to consumers. If the company has a high risk of going bankrupt, no price is cheap enough we would need a very significant margin of safety before even considering a position.
Because if it goes bankrupt, there’ll be no cash flows to discount back to the present and the value of our investments would be a big fat zero.
Secondly, the bulk of the value comes from year 10 and beyond. Therefore, investing requires long-term thinking and addressing the most important question:
“Why will this business become bigger and stronger 10 years from now?”
There will be a lot of noise in the short-term, where misses in quarterly earnings would send stock prices tumbling down. During moments like these, I’ll close my eyes and think about the likelihood of the business becoming stronger 10 years from today.
Understanding that bulk of the value comes from year 10 and beyond keeps me grounded as an investor and stays focused on the long-term.
Issues With The DCF Model
Remember that in a DCF model, we would apply a stable growth model to estimate the value beyond year 10?
Well, the assumption is the company’s growth will slow down to match the GDP’s growth rate, between 2% to 4% for two reasons:
We can’t project a company’s cash flows into infinity. The stable growth model is a proxy for estimating the value of all future cash flows.
It can’t be greater than the GDP’s growth rate of 2% to 4%. Otherwise, we are assuming that the business will grow to be larger than the economy.
And here’s the problem, if we assume that the company’s growth will slow down to 2% to 4% after year 10, we will be massively undervaluing companies with long runways such as Amazon, Mastercard, Salesforce, and more.
Amazon, for example, has grown revenues at over 20% a year for over 20 years!
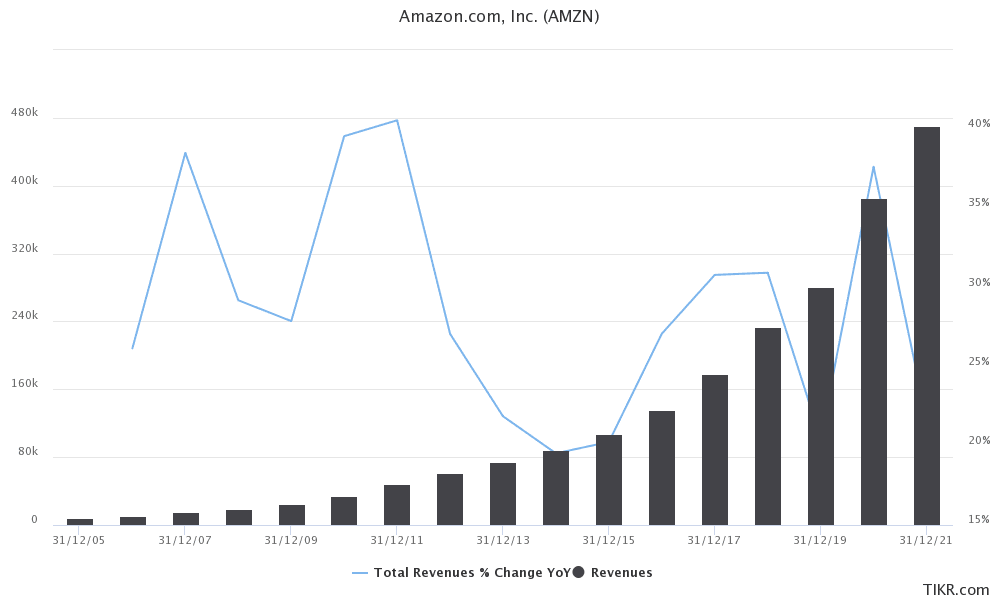
So the DCF model definitely isn’t ideal for valuing high-quality compounders, companies that are able to defy the law of mean reversion and are able to grow for a really long time.
So, how do we go about valuing these companies?
In the Valuation, 7th edition book, Koller et al. recommends that for high-growth companies or companies undergoing long-term structural changes, extend the explicit forecast period until the company reaches steady state. This means that for companies enjoying long tailwinds, we may perhaps have to forecast up to 20 to 30 years, or even more before applying a terminal value.
The issue here is that forecasting 10 years is already challenging enough and highly inaccurate. Take a look at this Facebook’s DCF by JP Morgan back in 2011, the analyst projected for Facebook’s 2020 revenue to be 29.9b but the actual figure turned out to be 85.9b instead; which is almost three times higher than the analyst had forecasted.

And this is just the revenue figure! Other variables that we need to estimate include the margins, the change in working capital, capital expenditures and more. Estimating a company’s performance 10 years out or more is an imprecise exercise.
How else can we approach valuation?
The DCF is what is commonly taught in finance and is great for thinking in first principles. In practice, many investors would use a forward relative valuation model.
2. Forward Relative Valuation Model
Rather than discounting the cash flows for the projected years and applying a stable growth model to find out the terminal value, we will apply an exit multiple in the final projected year.
In this model, we typically project three to five years out for two reasons:
The further we attempt to forecast, the more mistakes/inaccurate it will be, and
There’s no need to project that far out to apply the steady state growth model since we are using an exit multiple instead.
In selecting the exit multiple, we can apply the business’ historical multiple, the comparable businesses multiple or the industry’s multiple. It is important for us to understand the assumptions that enter the multiples blackbox:
Expected growth
The rate of return on new capital (profitability of business)
The cost of capital (largely tied to capital structure and interest rates)
Select a comparable multiple that fits the profitability, capital needs and growth rate of the business that you are valuing.
Let’s take a look at how Bill Ackman’s Pershing Square does it for Starbucks back in Oct 2018:

Based on Pershing Square’s estimates, Starbucks’ expected EPS was $2.41 for 2018.

The EPS was then projected to grow to a range of between $3.70 to $4.35 by 2022.
The underlying assumptions for the growth in EPS was a combination of same store sales (SSS) growth, increase in number of stores, share buybacks and operating leverage (increase operating margins).
Pershing Square then applied an exit P/E multiple of 25x and 27x.
How did Pershing Square derive an exit P/E multiple of 25x to 27x? Take a look at Starbucks historical P/E multiple chart below:

The average P/E multiple of Starbucks was 26.6x with the absolute low being 19.5x (where Ackman took a position) and maximum going up to 35.5x. Using a range of 25x to 27x seems reasonable if we assume that Starbucks was able to continue growing and defend its competitive advantage.
Read more: Figuring out a company’s intrinsic value with the PE ratio
Applying the multiple of 25x to 27x to the projected EPS of $3.70 and $4.35 respectively, the expected share price of Starbucks would come up to $93 and $117.
Starbucks was paying dividends by this time and it is expected to pay out $5 per share over three years. Including dividends, this would bring the implied value per share up to $97 and $122.
Pershing acquired 15.2 million shares at an average cost of $51 per share, with an implied value per share of $97 and $122 respectively, this represents a CAGR of 20% to 30% over 3 years.
Issues With The Forward Relative Valuation Model
Applying a multiple is a black box, because embedded within the multiple are assumptions of a business profitability, capital requirements, growth expectations and the cost of capital.
Also, multiples have further nuisances that could result in an unfair comparison. Let’s examine the issues associated:
The P/E Multiple
The P/E multiple mixes capital structure and nonoperating items with expectations of operating performance.
To show how capital structure distorts the P/E, let’s take a look at company A and B which trades at 10x enterprise value (EV) to EBITA, but trades at a different P/E. Notice that company A and B differ only in how they are financed, not their operating performance.

To overcome the issue of companies having different capital structures, we see many analysts use the EV/EBIT or EV/EBITA as an exit multiple. Let’s explore them below.
The EV/EBIT and EV/EBITA Multiple
The EV/EBIT multiple overcomes the problem of different capital structure but it doesn’t exclude the impact of amortization. Valuation by Mckinsey recommends using the EBITA or NOPAT multiple instead to overcome the impact of amortization.
Here’s why.
Amortization is non-cash, and unlike depreciation, the replacement/maintenance of these intangible assets is already incorporated in EBITA through marketing and selling expenses.
To see how amortization distorts the EV/EBIT multiple, let’s take a look at company A, B and C. The difference is that company A grew by acquiring company B while company C grew organically. Observe that the operating performance of the merged company A+B is identical with company C, but due to its acquisition, it incurred amortization expenses which reduced its EBIT, 125 in company A+B and and 200 for company C.
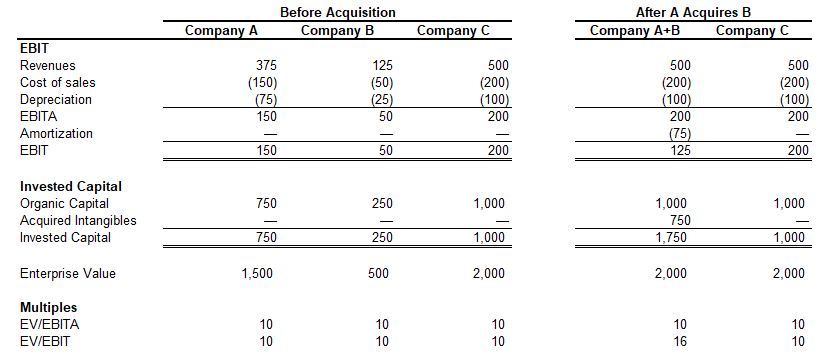
Hence, applying the EV/EBITA or EV/NOPAT multiple would be the most ideal if we are comparing across different businesses and industries.
Does That Mean That Valuations With P/E & EBIT Multiples Are Wrong?
Far from it! Many analysts (and myself) still use these multiples from time to time, especially for back of the envelope calculation of valuation. It's more important to understand the pitfalls of each multiple and not use them to compare companies whose capital or expense structures differ drastically.
Conclusion
Understanding the DCF is important for knowing where the value drivers are, and especially during volatile moments in the market, thinking from first principles allows us to have a better understanding of whether Mr. Market is overreacting. In practice, most fund managers would apply a forward relative valuation model. But we must be mindful of its constraints when selecting the appropriate multiple for comparison.
Intrinsic Value Calculator
An intrinsic value calculator is helpful for estimating a company’s value.
Create your own, or download and use mine for free:
Helpful Resources
Of course, none of what I wrote here was conceived by myself. I’m a beneficiary of those who are more intelligent and have thought carefully about the subject of valuation. I’m standing on the shoulders of giants as I summarized my learnings into this post.
If you like to read more in-depth into the works of giants, here are some helpful resources:
The P/E Ratio: A User’s Manual by Epoch Investment Partners
The Math of Value and Growth by Michael Mauboussin
Getting ROIC right: how an accurate view of ROIC can drive improved shareholder value
Calculating Return on Invested Capital by Michael Mauboussin
Thoughts on Valuation by Michael Mauboussin
Primer on ROIC Framework by Bear Stearns
Common Errors in DCF Models by Michael Mauboussin
Valuation Multiples: A Primer by UBS
DCF Methodology by Bear Stearns
Thoughts on Valuation II: An Epistemological View
Valuing Subscription-Based Businesses
Networking Industry: Does Valuation Matter?
Finding the Right P/E Multiple – Or How to Handicap a Stock
Mind Matters: The Dangers of DCF
The Trouble with Earnings and P/E Multiples
Calculating Incremental ROIC by Hayden Capital
Questions About ROIC & Valuation
The Role of Growth in Achieving Superior Value Creation by BCG
Aswath Damodaran’s Youtube Playlist on Valuation